Radar Chart
A stat-spread polygon: several live values plotted at once, one per axis.
About 3 minutes
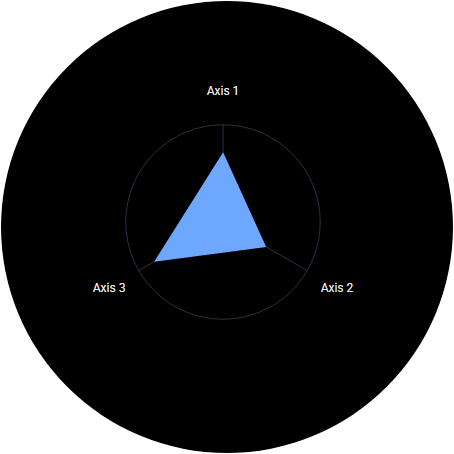
A stat-spread chart: labelled spokes (axes) radiate from a centre point, each axis plots its own value, and the points join into a filled shape. Every other gauge shows one value; a Radar Chart compares several at a glance, like a character sheet or a build comparison. It's for games and apps (it isn't offered in watch face projects).
Settings
| Setting | What it does |
|---|---|
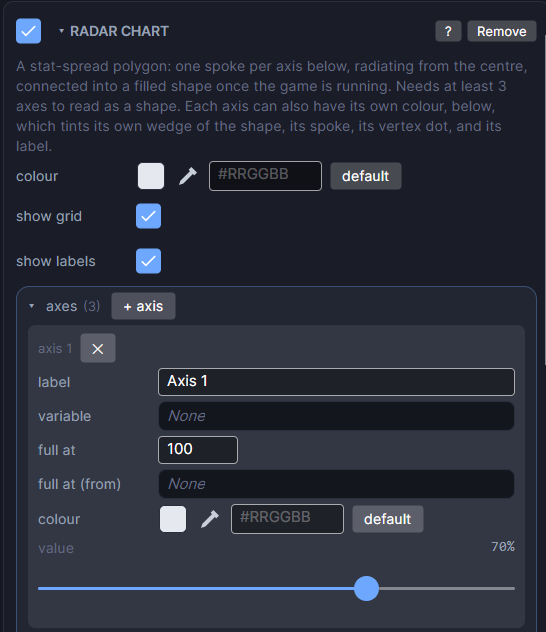
| colour | The colour and opacity of the filled shape. |
| show grid | Draws the background ring and spokes. Turn it off to show only the filled shape. |
| show labels | Draws each axis's name at the end of its spoke. Works on its own, separate from show grid. |
| axes | The list of spokes. Click + axis to add one, and ✕ to remove one. They're drawn starting at 12 o'clock and going clockwise. |
Each axis
| Setting | What it does |
|---|---|
| label | The name shown at the outer end of the spoke, like STR or Speed. |
| variable | The variable this axis plots while the game runs (Preview and on the watch). Leave it blank to always use value below. |
| full at | The value that reaches the outer end of the spoke. |
| full at (from) | Optional. Use another variable's live value as this axis's goal instead of full at. |
| colour | This axis's own colour. It tints its wedge of the shape, its spoke, its point and its label. Leave it on default for a plain grey spoke and the chart's normal fill. |
| value | A slider from 0 to 100 percent. It's what the Scene shows while you edit, and what the axis shows if variable is blank. |
How to use it
- Add a Radar Chart and size its box. The chart fits inside it.
- Click + axis at least three times. With fewer than 3 axes you get the grid but no filled shape.
- Give each axis a label and a variable, like
attack,defenseandspeed, and set full at to the highest value each stat can reach. - Press Play to watch the shape change as the variables change.
Make one stat stand out
Give just one axis its own colour (say, the stat the player just upgraded). Its wedge lights up while the rest keep the normal fill.
Good to know
- Runs on both Wear OS and Apple Watch builds.
- Each axis has its own full at, so stats with different ranges (HP out of 500, Luck out of 10) can share one chart.
- To show a variable's number next to the chart, add a Text object with Bind Text.
Every object also has the shared rows (position, size and more), explained once in Settings Every Object Shares.